Logs
SkillFlaw produces logs for individual flows and the SkillFlaw application itself using the structlog library for logging.
The default logfile name is skillflaw.log.
Log storage
SkillFlaw resolves SKILLFLAW_CONFIG_DIR to the platform cache directory for the skillflaw app when you don't set it explicitly.
That means defaults such as ~/Library/Caches/skillflaw on macOS and ~/.cache/skillflaw on Linux.
The logger uses the following runtime variables:
| Variable | Format | Default | Description |
|---|---|---|---|
SKILLFLAW_CONFIG_DIR | String | Platform cache dir | Base runtime configuration directory used by SkillFlaw for local config and storage. |
SKILLFLAW_LOG_LEVEL | String | ERROR | Sets the log level as one of DEBUG, INFO, WARNING, ERROR, and CRITICAL. |
SKILLFLAW_LOG_FILE | String | logs/skillflaw.log at settings level | Overrides the log file path. If the parent directory doesn't exist, the logger falls back to the platform cache directory and writes skillflaw.log there. |
SKILLFLAW_LOG_ENV | String | default | Primary log format controller. container/container_json emits JSON logs, and container_csv emits key-value output. |
SKILLFLAW_PRETTY_LOGS | Boolean | True | Controls console rendering when SKILLFLAW_LOG_ENV is default. |
SKILLFLAW_LOG_FORMAT | String | Not set | Optional custom console/key-value rendering selector. |
SKILLFLAW_LOG_RETRIEVER_BUFFER_SIZE | Integer | 0 unless set | Enables and sizes the in-memory buffer used by Logs endpoints. |
If you want logs in a predictable location, set SKILLFLAW_LOG_FILE explicitly in your .env file and then start SkillFlaw with uv run skillflaw run --env-file .env.
View logs in real-time
To monitor SkillFlaw logs as they are generated, follow the active log file.
-
Change to the directory that contains your active log file.
- macOS
- Windows
_10cd ~/Library/Caches/skillflaw_10cd %LOCALAPPDATA%\skillflaw\Cache -
Tail the main log file:
- macOS
- Windows
_10tail -f skillflaw.log_10Get-Content -Wait -Path skillflaw.logIf you don't see new log entries, check that SkillFlaw is running, and perform some actions to generate log events. You can also check the terminal where you started SkillFlaw to see if logs are being printed there.
Flow and component logs
After you run a flow, you can inspect the logs for each component and flow run.
For example, you can inspect Message objects ingested and generated by Input and Output components.
View flow logs
In the visual editor, click Logs to view logs for the entire flow:
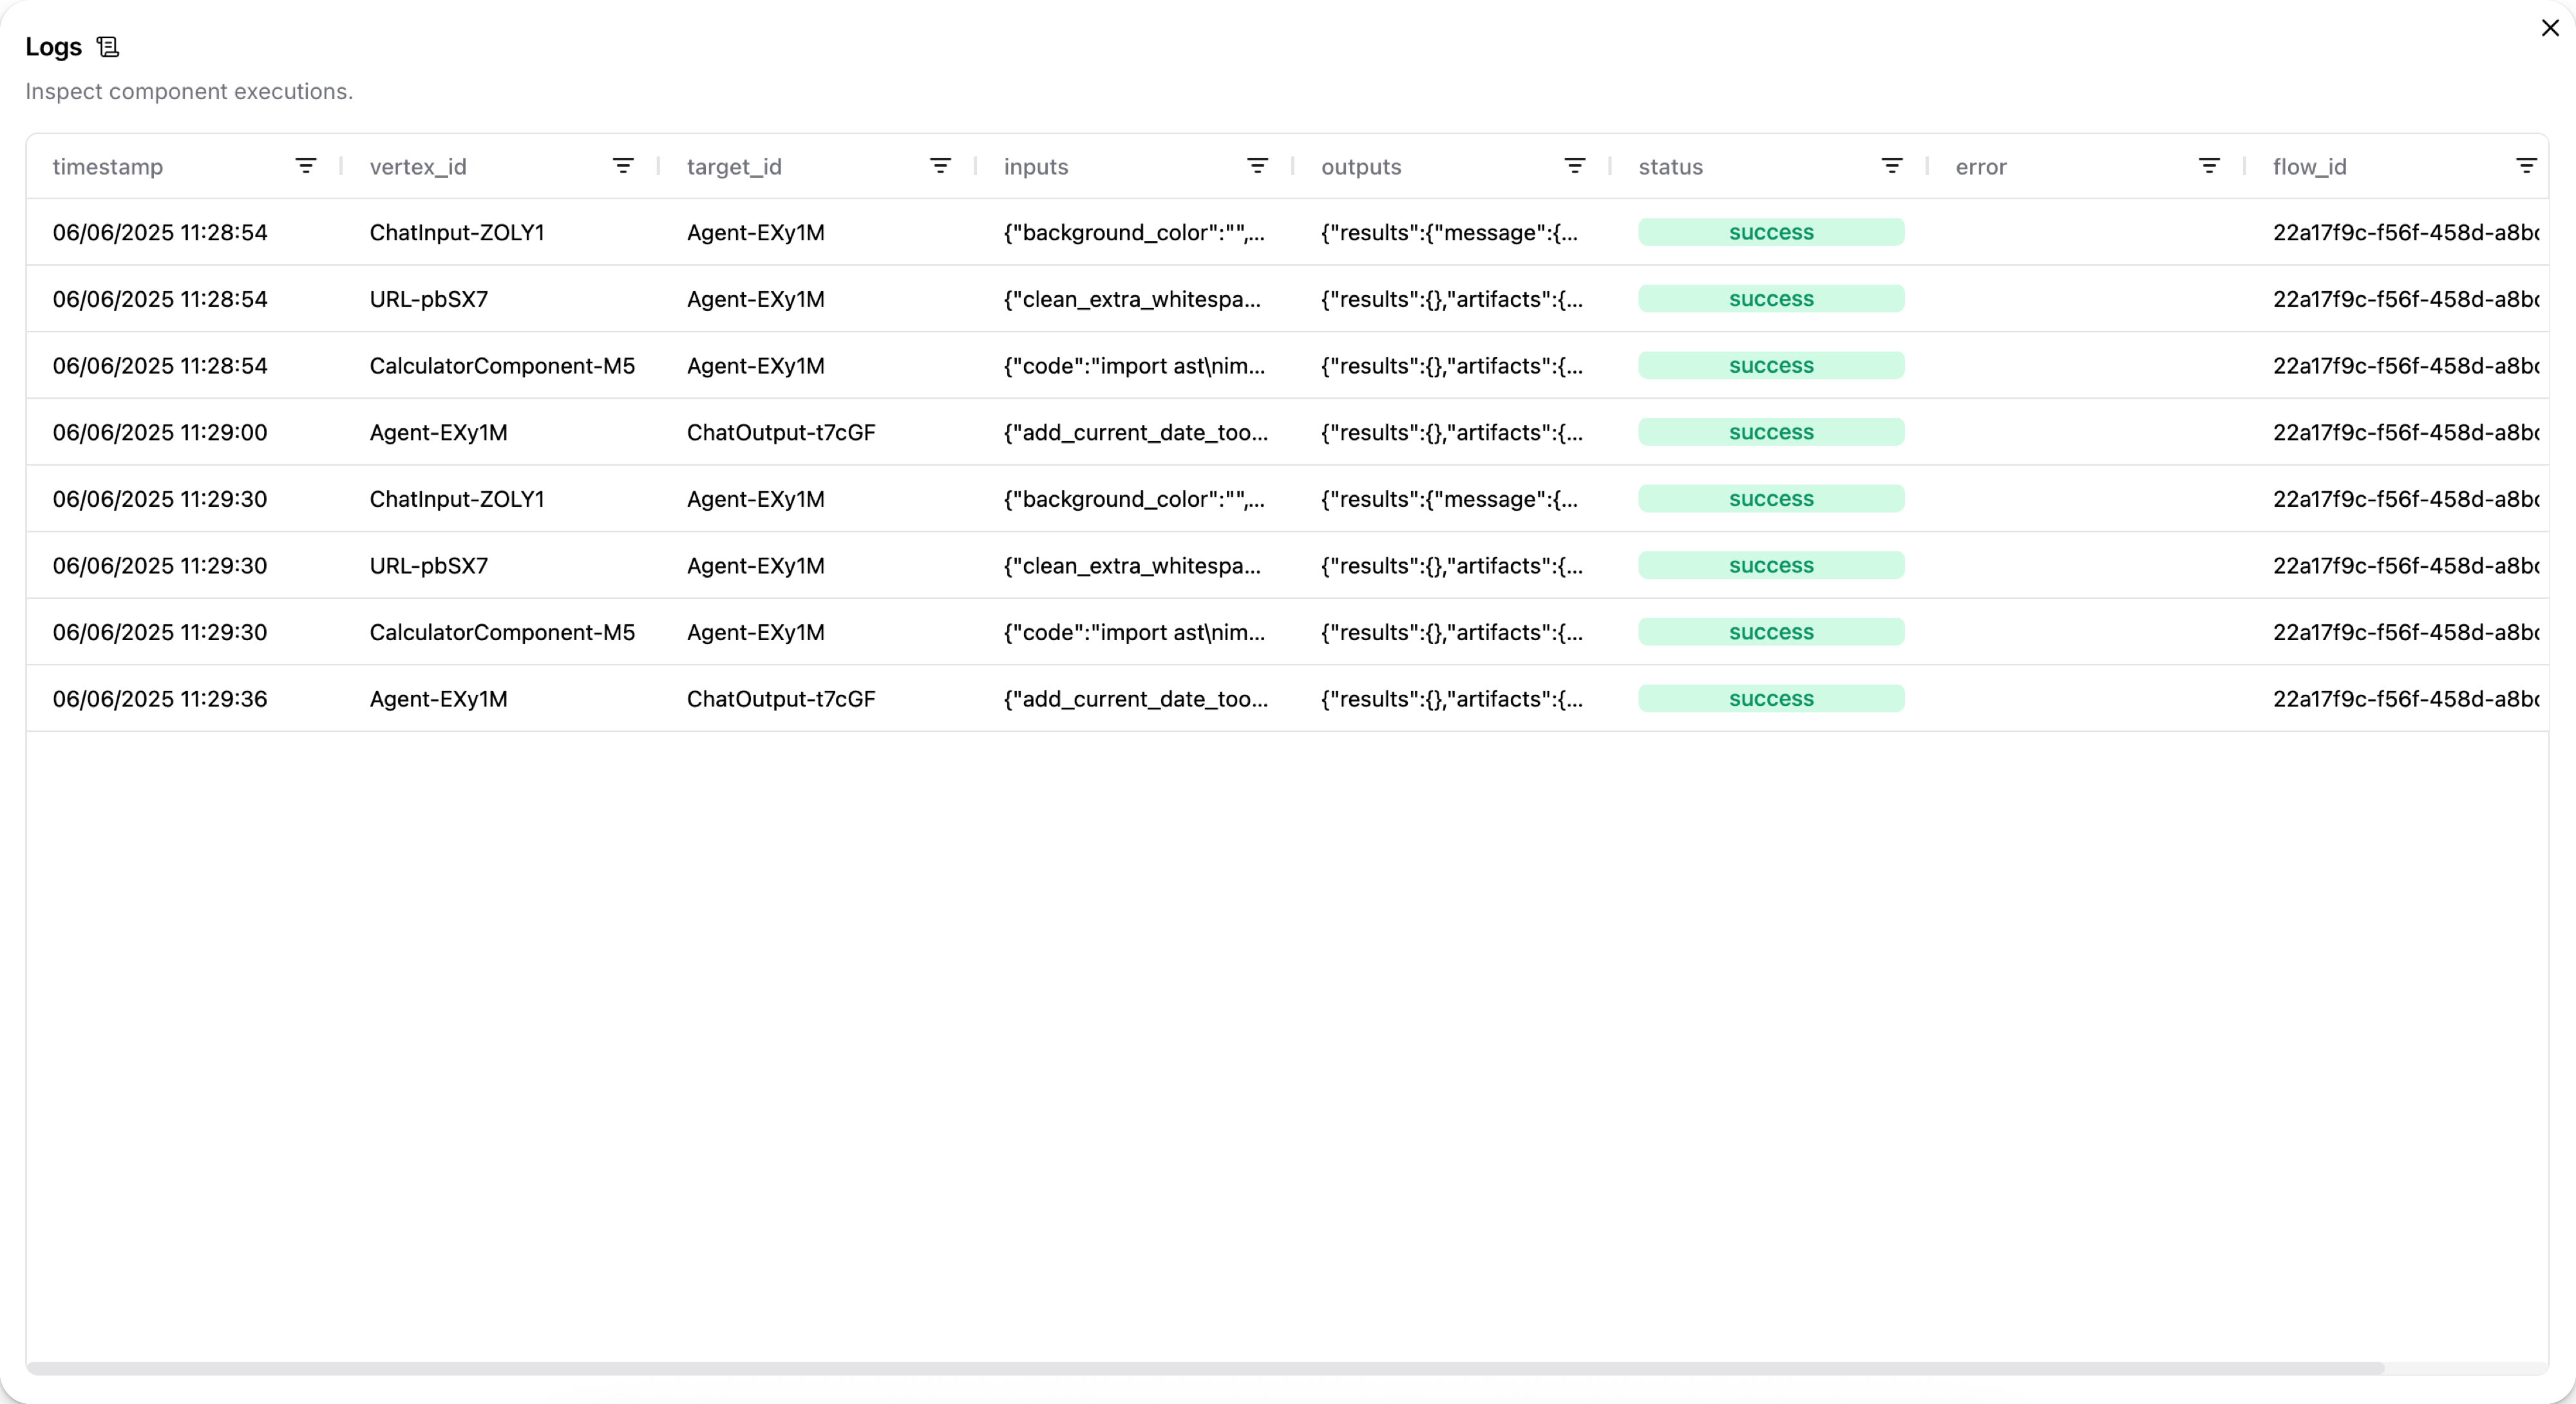
Then, click the cells in the inputs and outputs columns to inspect the Message objects.
For example, the following Message data could be the output from a Chat Input component:
_12 "messages": [_12 {_12 "message": "What's the recommended way to set up Python on macOS?",_12 "sender": "User",_12 "sender_name": "User",_12 "session_id": "Session Apr 21, 17:37:04",_12 "stream_url": null,_12 "component_id": "ChatInput-4WKag",_12 "files": [],_12 "type": "text"_12 }_12 ],
In the case of Input/Output components, the original input might not be structured as a Message object.
For example, a language model component can pass a raw text response to a Chat Output component that is then transformed into a Message object.
You can find .log files for flows at your SkillFlaw installation's log storage location.
For filepaths, see Log storage.
View chat logs
In the Playground, you can inspect the chat history for each chat session. For more information, see View chat history.
View output from a single component
When debugging issues with the format or content of a flow's output, it can help to inspect each component's output to determine where data is being lost or malformed.
To view the output produced by a single component during the most recent run, click Inspect output on the component in the visual editor.
Access SkillFlaw Desktop logs
If you encounter issues with SkillFlaw Desktop, you might need to collect startup logs for debugging. The packaged desktop runtime is distributed separately from the source workspace, so its exact log directory is packaging-specific. When possible, use the desktop app's built-in support/export workflow or inspect the application log directory exposed by your package build.
- macOS
- Windows
-
Reproduce the issue in SkillFlaw Desktop.
-
If your build exposes a support bundle or log-export action, use it first.
-
If you need to inspect logs manually, open the desktop app's application log directory from Finder or Terminal.
For Python/CLI deployments, use the server log workflow in View logs in real-time.
-
Reproduce the issue in SkillFlaw Desktop.
-
If your build exposes a support bundle or log-export action, use it first.
-
If you need to inspect logs manually, open the desktop app's application log directory from Explorer or PowerShell.
For Python/CLI deployments, use the server log workflow in View logs in real-time.
You can use the log file to investigate the issue on your own, add context to a GitHub Issue, or send it to your support channel for debugging assistance.